
How do you calculate TAM in a way investors and boards actually trust? #

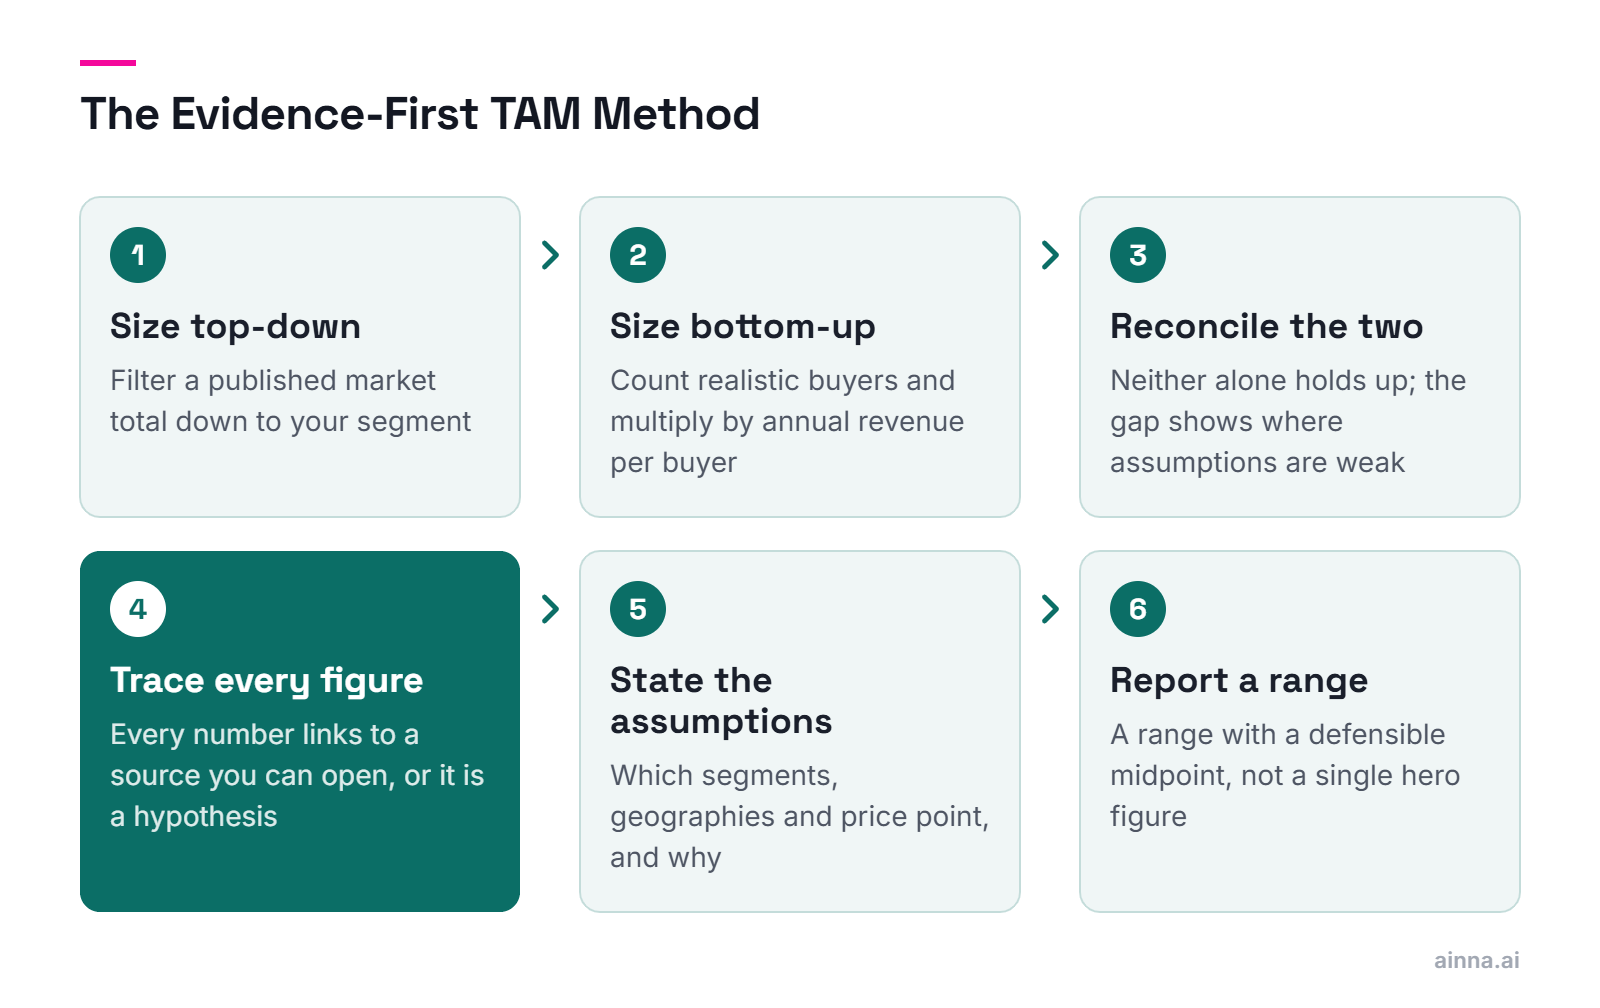
Calculate TAM with more than one method and make every figure traceable to a source. In our Innovation Mode methodology this is the Evidence-First TAM Method: size the market top-down and bottom-up, reconcile the two, and attach a verifiable source to each number, so the estimate holds up under scrutiny instead of falling apart the moment someone asks where a figure came from.

  • Top-down alone is a guess dressed up as a number; bottom-up alone misses the ceiling. Credible sizing does both and reconciles them
  • Every figure in the model traces to a source you can open. Anything untraceable is a hypothesis, not a number
  • State assumptions in the open: which segments, which geographies, which price point, and why
  • Report TAM as a range with a defensible midpoint, not a single hero figure
  • Separate TAM, SAM, and SOM cleanly. Conflating total demand with what you can win is the fastest way to lose credibility
  • The number that earns investment is not the largest one, it is the one you can defend line by line
Key Takeaway

Defensibility beats size. A modest market you can prove is worth more in a fundraise than a huge one you cannot reconstruct.
Inside Ainna Stop guessing at TAM, SAM and SOM. Market sizing with assumptions you can defend in the room. Size my market

What's the difference between top-down and bottom-up market sizing? #

Top-down sizing starts from a large published market figure and narrows it to your segment; bottom-up sizing builds the market up from the number of real customers multiplied by what each pays. Our Three-Lens Triangulation approach uses both, plus a value-based lens for new categories, and treats agreement between them as the signal that the estimate is sound.

  • Top-down: begin with an analyst market total, then filter down by geography, segment, and use case. Fast and directional, but easy to inflate
  • Bottom-up: count the realistic buyers and multiply by annual revenue per buyer. Slower, harder, and far more defensible because every input is sourced or measured
  • Value-based: estimate the economic value your product creates and the share you can capture. The right lens when no market has been sized yet
  • The three lenses should converge. When they do, confidence is earned rather than asserted
  • Divergence between lenses is a flag, not a failure, and investigating it is where real understanding of the market comes from
Key Takeaway

Do not pick one method. Run at least two and let the gap between them tell you where your assumptions are weak.

Why do most TAM estimates fall apart under scrutiny? #

Most TAM estimates fail because they rest on a single top-down number with no traceable sources and no bottom-up check. The pattern is always the same: one large analyst figure, a percentage pulled from nowhere, and a conclusion nobody in the room can reconstruct.

  • Single-method sizing: a top-down figure with nothing to cross-check it against
  • The unsourced percentage: 'we only need to capture 1% of a $50B market' is an admission that no real sizing was done
  • TAM standing in for revenue: total demand is not your forecast, and treating it as one signals inexperience
  • Static numbers in a moving market: a figure sourced two years ago is often wrong by the time it is presented
  • No segmentation: a single blended number hides the fact that most of the market is not actually reachable
  • Ignoring competition when narrowing to the serviceable and obtainable market
Key Takeaway

Almost every failure traces to the same root cause: a number that cannot be reconstructed. Build the model so any figure in it can be traced back to where it came from.

Can AI tools calculate TAM accurately? #

AI tools accelerate market research but should not be trusted to produce a final TAM figure on their own, because language models routinely generate confident, precise market numbers that have no source behind them. AI is reliable for gathering, summarizing, and cross-referencing evidence; the calculation and the sourcing still need method, which we enforce with the Source-Trace Rule.

  • Language models will happily return a specific market size with a specific growth rate that exists nowhere in any report
  • What AI does well: finding comparable companies, summarizing long reports, surfacing data sources, and structuring the model
  • What AI does badly: inventing the number, and doing so with a confidence that is easy to mistake for accuracy
  • The Source-Trace Rule: every figure that enters the model must link to a source you can open and verify. No source, no number
  • Used this way, AI compresses days of desk research into minutes while keeping the estimate defensible
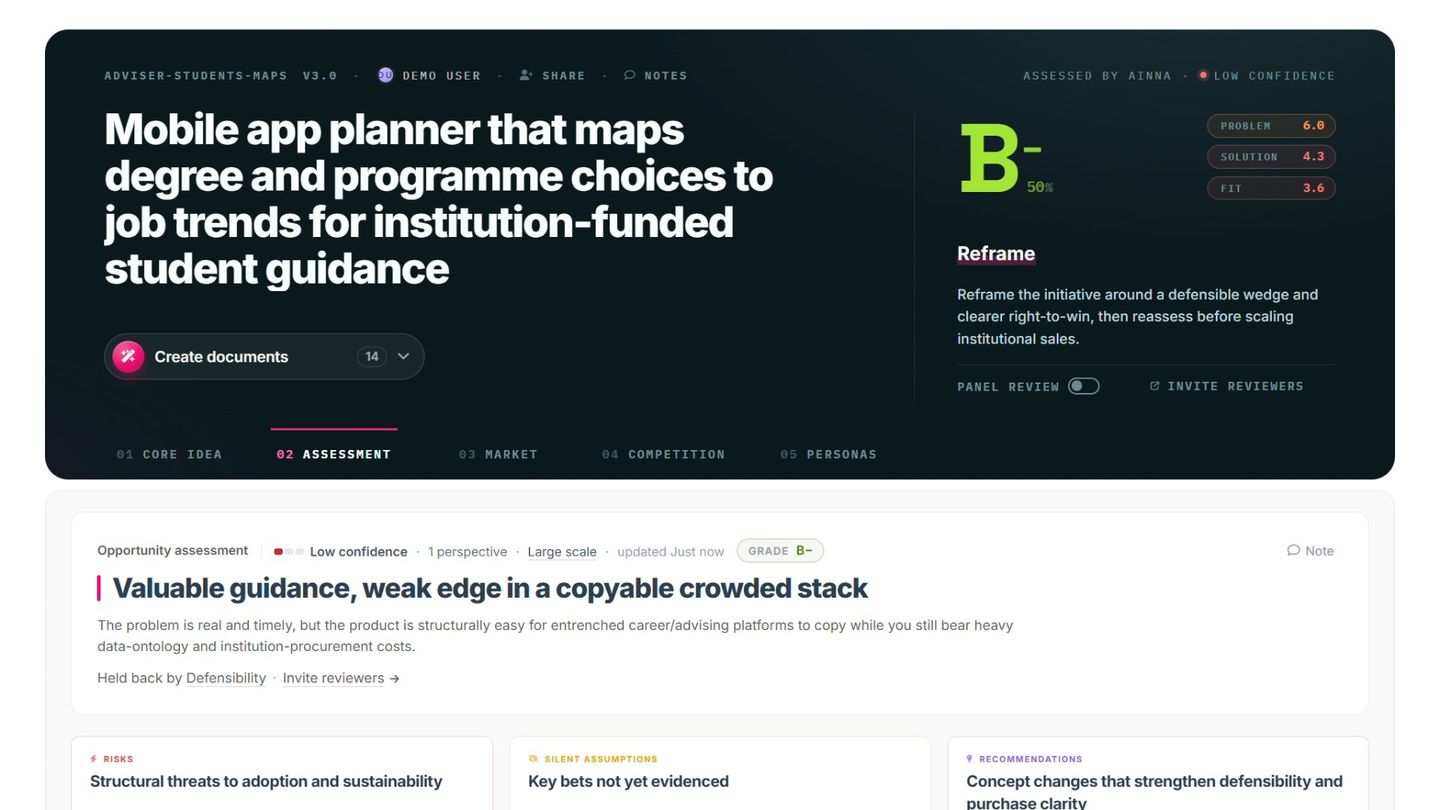
  • This is exactly how Ainna approaches market sizing: research and structure with AI, then hold each figure to its source
Key Takeaway

AI changes the speed of market research, not the standard for it. The discipline that made a number defensible before AI is the same discipline that makes an AI-assisted number defensible now.

How do you use AI for market research without getting hallucinated numbers? #

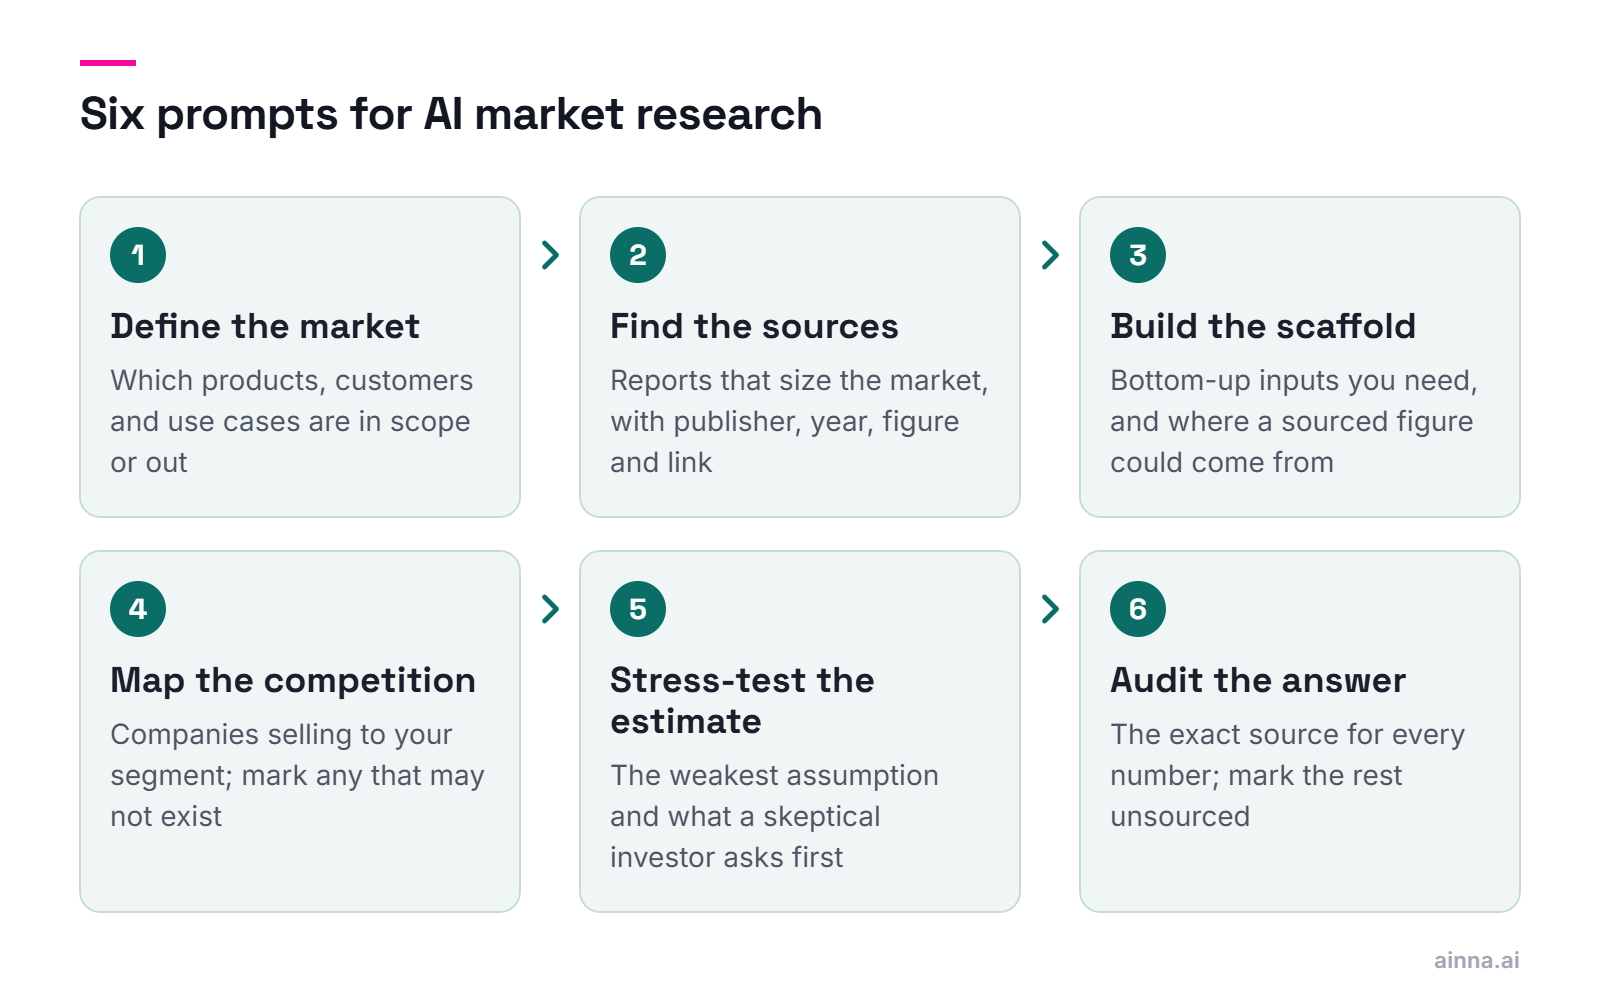
Use AI to find and organize sources, not to invent conclusions, and require every figure it returns to arrive with a citation you can open. In our methodology, market research is handled the way an innovation intelligence function works: AI continuously gathers market, competitor, and demand evidence, and each figure is traced to its origin before it enters the model.

  • Ask AI for sources and comparables, not for the answer. 'Find the reports that size this market' beats 'what is the market size'
  • Verify each figure at the source before it counts. A citation you have not opened is not a citation
  • Use AI to keep the model current, re-checking figures as reports and pricing change rather than sizing once and forgetting
  • Have AI build the bottom-up scaffold (segments, counts, price benchmarks) so a human can challenge each input
  • Cross-reference across independent sources; a figure that appears in three unrelated places is far stronger than one that appears in one
  • Pair the research with a competitive read so the serviceable market reflects who else is fighting for it
Key Takeaway

Treat AI as a research analyst who works fast but must show their work. The output is only as trustworthy as the sources it can point to.

What sources make a market-sizing estimate defensible? #

A defensible estimate rests on independent, verifiable sources: industry analyst reports, government and trade statistics, comparable-company financials, and your own primary demand data. The strongest models triangulate across source types so no single report carries the whole argument.

  • Analyst and market-research reports (the Gartner, IDC, Statista category) for top-down totals and growth rates
  • Government and statistical databases (census, Eurostat, national statistics offices) for population, business counts, and spend
  • Public-company filings and published pricing for grounding average contract value and unit economics
  • Primary demand signals (customer interviews, pilots, waitlists, letters of intent) for the bottom-up count that only you can gather
  • Recency matters as much as authority; a fresh secondary source often beats a stale premium one
  • The point is not one perfect source, it is enough independent sources that the estimate stands even if one is wrong
Key Takeaway

Defensibility is a portfolio property, not a single-source one. Spread the argument across source types so no one figure can sink it.

How do you calculate TAM bottom-up? #

Bottom-up TAM multiplies the number of realistic buyers by the annual revenue each represents. It is the most defensible lens because every input is something you can source or measure: how many potential customers exist, and what each would pay per year.

  • Define the buyer unit precisely: a company, a team, a seat, a household, a device
  • Count the units by building up from segments, using statistics and comparable data rather than a single blended guess
  • Estimate annual revenue per unit from your pricing, or from comparable-company pricing if you are pre-revenue
  • TAM equals total units multiplied by annual revenue per unit, at 100% adoption and 100% share
  • Narrow to SAM (the slice your business model and geography can actually serve) and SOM (what you can realistically win near-term)
  • Because each input is explicit, a reviewer can challenge any one of them without discarding the whole model
Key Takeaway

Bottom-up is more work, and that is precisely why it convinces. A number built from countable parts invites scrutiny instead of fearing it.

How do you calculate TAM top-down? #

Top-down TAM starts with a large published market size and applies successive filters to isolate the portion that is genuinely yours. Done well it is fast and directional; the discipline lives in the filters, each of which must be justified and sourced rather than assumed.

  • Start from a credible total market figure and cite it
  • Apply filters in sequence: geography, segment, use case, willingness and ability to pay
  • Give every filter a rationale. 'We remove non-English markets because the product is English-only' is a filter; '50% feels right' is not
  • Keep the chain reconstructable, so anyone can follow the total down to your number
  • Use the top-down result as a ceiling and sanity check against your bottom-up build
  • Be alert to double-counting and overlapping reports, which quietly inflate the starting total
Key Takeaway

Top-down is a sanity check, not a proof. Trust it to bound the market, and trust bottom-up to size it.

What is value-based market sizing and when should you use it? #

Value-based sizing estimates a market from the economic value your product creates and the share of that value you can realistically capture. It is the right lens for genuinely new categories, where no analyst has sized the market yet because the market does not exist in the reports.

  • Quantify the value created per customer: cost saved, revenue enabled, risk reduced, or time returned
  • Multiply by the affected population, then by a defensible value-capture rate (the share of value you can price for)
  • Anchor the capture rate in comparable pricing norms rather than optimism
  • Use it for new categories, platform shifts, and products that replace a behavior rather than an existing purchase
  • Pair it with analogous-market reasoning so the estimate is bounded by something real
  • Label it clearly as a value hypothesis to be validated, which is exactly what product discovery and early experiments are for
Key Takeaway

When there is no market to measure, size the value instead. Just be honest that a value-based number is a thesis to test, not a fact to bank.

How do you reconcile top-down and bottom-up numbers when they disagree? #

When top-down and bottom-up disagree, treat the gap as information: it usually means a filter is wrong or an assumption is unsupported, and finding which one is where the real understanding of the market comes from. Reconciliation, not averaging, is the whole point of triangulation.

  • Do not split the difference. Averaging two numbers you do not understand produces a third number you also do not understand
  • Trace the gap to its driver: an inflated top-down total, an incomplete bottom-up count, or a mismatched definition of the buyer unit
  • Check that both methods are sizing the same thing, in the same geography, over the same time window
  • Hunt for double-counting on the top-down side and for missing segments on the bottom-up side
  • Converge to a range with a defensible midpoint, and document how you got there
  • A reconciled range signals rigor; a single suspiciously round number signals its absence
Key Takeaway

The disagreement is the value. Reconciling it forces out the weak assumption that a single-method estimate would have hidden.

True innovation goes beyond isolated programs, technology labs, hackathons, fancy collaboration spaces, and bold innovation titles.

How do you size a market that doesn't exist yet? #

Size a nonexistent market with analogous markets and value theory rather than with reports that have not been written. Find the closest existing markets that share your buyer, your budget, or the behavior you are replacing, and size from the value your category creates for that same population.

  • Analogous-market anchoring: identify markets adjacent to yours in buyer, budget, or job-to-be-done, and use them as reference points
  • Substitution budgets: measure what people already spend to solve the problem today, even if the solution looks nothing like yours
  • Value-based sizing: estimate the value created and a realistic capture rate when no existing spend maps cleanly
  • Stage it to the adoption curve; a new category's near-term obtainable market is a fraction of its long-term potential
  • Be explicit that the number is a hypothesis, and pair it with the MVP and experiments that will test it
  • This is opportunity framing, and our Business Idea Template gives it a structured starting point
Key Takeaway

New categories are not unsizeable, they are sizeable only by analogy and value. Show the reasoning, and let validation replace estimation over time.

How does competition affect your addressable market? #

Competition does not change your TAM, but it sharply constrains your SAM and SOM: the market you can realistically serve and obtain shrinks with every credible incumbent, switching cost, and locked-in channel in the category. Treating the full TAM as winnable is one of the most common ways a market model misleads.

  • TAM is total demand for the solution, independent of who else sells it
  • SAM is constrained by where you can actually compete: your segments, geographies, and business model
  • SOM is constrained further by the share you can take against incumbents, given switching costs and distribution
  • Map the competitive field before you set SOM, so the number reflects reality rather than ambition. A structured competitive analysis is the input here
  • Entrenched incumbents, high switching costs, and exclusive channels all compress the obtainable share
  • A SOM that ignores competition is not a target, it is a wish
Key Takeaway

Competition lives in the SAM and SOM, not the TAM. The teams that get this right present a smaller obtainable market and a far more credible one.

How do you turn SOM into a realistic go-to-market target? #

Turn SOM into a target by choosing the beachhead segment you can win first and sizing that, rather than the whole obtainable market at once. A credible near-term number is a single segment you can dominate, which then becomes the wedge into the broader SOM.

  • Pick a beachhead: the narrowest segment where your product is the obvious choice
  • Size the beachhead bottom-up, then let it expand outward as you win it (land, then expand)
  • Tie the number to your actual go-to-market motion and capacity, not to a share percentage of the total
  • Ground the first-year target in pipeline math: reachable accounts, conversion rates, and sales capacity
  • Connect it to your go-to-market strategy so the sizing and the plan agree
  • A focused beachhead target beats a diluted assault on the entire obtainable market
Key Takeaway

SOM tells you the prize; the beachhead tells you where to start. Size the wedge you can win now, and earn the right to the rest.

Inside Ainna Who else is solving this, and where is the gap? Ainna maps the competitive landscape from your product concept. Map my competition

How much market-sizing detail belongs in a pitch deck vs a business case? #

A pitch deck needs the headline TAM, SAM, and SOM with the one-line logic behind each; the full model, sources, and sensitivity analysis belong in the business case. In our methodology these are two different documents with two different jobs: the pitch deck earns the meeting, and the business case earns the investment.

  • Pitch deck: one market slide, headline numbers, and a single line of method per figure. Enough to show the opportunity is real and the thinking is sound
  • Business case: the full model, every source, the bottom-up build, scenarios, and sensitivity to key assumptions
  • Match depth to the decision. A first meeting does not need your spreadsheet; a diligence process does
  • Keep the two consistent. The deck's headline number must be the business case model's output, not a rounder, friendlier version of it
  • Have the detailed model ready before you show the headline, because the first sharp question will ask for it
  • Use your pitch deck and product documentation to carry the right level of detail to the right audience
Key Takeaway

The deck is the headline; the business case is the proof. Put the number in the deck and the reason it is trustworthy in the document behind it.

What market-sizing mistakes make investors lose confidence? #

The fastest way to lose an investor is a market number they cannot reconstruct: a single top-down figure, an unsourced 'we only need 1%,' or a TAM that quietly stands in for revenue. Every credible model does the opposite, and building one with sourced, triangulated numbers is exactly what Ainna automates (free to start).

  • The 1% fallacy: 'we only need 1% of a huge market' tells an investor you have no idea how you will get the first customer
  • TAM as revenue: presenting total demand as if it were your forecast
  • Single-source numbers: one report, no cross-check, no bottom-up build
  • Stale figures: sizing on data that has since moved, and not noticing
  • Ignoring competition: a SOM that assumes incumbents will stand still
  • Round, sourceless confidence: a suspiciously clean number with nothing behind it reads as invented, because it usually is
Key Takeaway

Investors are not testing your market, they are testing your judgment. A sourced, triangulated, defensible number tells them your other numbers can be trusted too.

An unhealthy culture can be the single point of failure, even for the most well-planned, expensive innovation programs.

Inside Ainna

Stop Guessing at Your Market Size

Ainna applies our Innovation Mode methodology to research your market and generate a sourced, triangulated market-sizing section, so your pitch deck and business case start from numbers you can defend.

Ideas in →
Opportunities out.