Market Sizing Fundamentals

Understanding what market sizing is, why it matters, and the core concepts behind TAM, SAM, and SOM.

Market sizing is the process of estimating the revenue opportunity available for a product or service within a defined market. It matters because it forces you to answer the most fundamental strategic question before you build anything: is this opportunity large enough to justify the investment? But more importantly, the process itself—defining your customer, understanding the competitive landscape, mapping the value chain—produces strategic clarity that no spreadsheet number alone can deliver.

  • Quantifies the revenue opportunity available for your product in a defined market
  • Forces clarity on who your customer actually is and how many of them exist
  • Reveals whether the opportunity justifies the investment in time, money, and resources
  • The analytical process surfaces strategic insights beyond the final number
  • Required for investor pitches, board presentations, and internal funding decisions
  • Informs pricing strategy, go-to-market planning, and resource allocation

Market sizing is not about producing a big, impressive number. It's a strategic thinking exercise disguised as arithmetic. The teams that treat it as a box to check produce fantasy numbers. The teams that treat it as a discovery process produce genuine strategic insight about where to play and how to win.

TAM (Total Addressable Market) is the total revenue opportunity if you captured 100% of your market with zero constraints. SAM (Serviceable Addressable Market) is the portion of TAM you can realistically serve given your business model, geography, and capabilities. SOM (Serviceable Obtainable Market) is the portion of SAM you can realistically capture in a defined timeframe given competition, resources, and go-to-market capacity. Together, they form a funnel from theoretical maximum to practical, near-term revenue target.

  • TAM = Total Addressable Market: the entire revenue pool if every potential customer bought your product
  • SAM = Serviceable Addressable Market: the portion you can actually serve with your current model
  • SOM = Serviceable Obtainable Market: the portion you can realistically capture in a given timeframe
  • Each level narrows the funnel: TAM → SAM → SOM, from theoretical to practical
  • TAM shows ambition and ceiling; SAM shows focus and fit; SOM shows execution realism
  • All three should be grounded in transparent, challengeable assumptions

Think of it as a strategic zoom lens. TAM shows you the entire landscape—the theoretical ceiling. SAM focuses on the part of that landscape you can actually reach. SOM focuses on the ground you can credibly take. Each layer demands different thinking and produces different strategic value.

They form concentric circles—or more precisely, a funnel with each level filtering the one above it through increasingly specific constraints. TAM is filtered by your business model, geography, and channel to produce SAM. SAM is filtered by competition, go-to-market capacity, brand awareness, and execution capability to produce SOM. The ratios between them tell a story: if SOM is less than 1% of TAM, you either have a niche strategy or a credibility problem.

  • TAM → SAM: filtered by business model, geography, pricing, distribution, and product scope
  • SAM → SOM: filtered by competition, go-to-market capacity, brand, and execution realism
  • Typical SOM/SAM ratios for new entrants range from 1%–10% depending on market maturity
  • The filters between each level should be explicit, named, and quantifiable
  • A large TAM with a tiny SOM suggests either a wise beachhead strategy or an unfocused pitch
  • The ratios shift over time as you expand capabilities, enter new geographies, or add products

The relationship between the three levels tells a strategic story. Investors and stakeholders read that story carefully. A credible narrative explains why your TAM is large enough to be exciting, why your SAM reflects genuine focus, and why your SOM is achievable with the resources you have or are requesting.

When there's no existing market to measure, you size the problem instead of the product. Identify the jobs-to-be-done that your product addresses, quantify the current spend on alternative solutions (including time, workarounds, and manual effort), and estimate willingness to pay for a superior solution. This is where value-theory approaches and analogous market analysis become essential—and where most founders make their biggest sizing mistakes.

  • Size the problem, not the product: how much is currently spent solving this problem inefficiently?
  • Map the alternatives: what do people use today, including manual workarounds and 'doing nothing'?
  • Use analogous markets: similar products in adjacent categories provide reasonable proxies
  • Estimate willingness to pay through customer research, not assumption
  • Apply value-theory pricing: what fraction of the value you create can you capture as revenue?
  • Be honest about uncertainty—present ranges and scenarios, not false precision

Every market that exists today was once a new category. The smartphone market didn't exist before the iPhone—but the market for mobile communication, portable computing, and personal entertainment did. Your job is to identify the existing spend and behavior your product will redirect, and size that opportunity with transparent methodology. For deeper framing on new product opportunities, explore the product discovery documentation guide.

Anyone making an investment decision about a product needs market sizing—whether that investment is venture capital, corporate budget allocation, or your own time as a founder. The depth and formality vary: a hackathon team needs directional sizing in hours; a Series A startup needs rigorous, defensible analysis; a corporate product team needs methodology that aligns with internal planning frameworks. The common thread is that every product decision is implicitly a bet on market size, whether you make that bet explicit or not.

  • Founders: required for investor pitches, validates whether the idea is worth pursuing
  • Product managers: informs roadmap prioritization, resource allocation, and business cases
  • Corporate innovation teams: justifies investment in new initiatives to leadership
  • Hackathon participants: provides strategic credibility to pitches and validates the opportunity
  • Investors: used to evaluate whether returns can justify the risk and check size
  • Strategic planners: informs market entry, expansion, and portfolio decisions

If you're building a product without understanding the market, you're navigating without a map. The formality of the analysis should match the stakes—but even rough, directional market sizing changes the quality of your decisions.

Total Addressable Market (TAM)

Understanding, calculating, and communicating your Total Addressable Market.

There are three primary approaches: top-down (start with industry data and narrow), bottom-up (start with unit economics and scale), and value-theory (estimate based on value delivered to customers). The most credible TAM analysis uses at least two methods and triangulates between them. If your top-down and bottom-up estimates differ by more than 3–5x, your assumptions need work.

  • Top-down: start with industry reports (Gartner, IDC, Statista), apply relevant filters to narrow to your category
  • Bottom-up: count potential customers × average revenue per customer × purchase frequency
  • Value-theory: estimate total value your product creates for customers × percentage you can capture as price
  • Triangulate: use multiple methods and explain the discrepancies between them
  • Always state assumptions explicitly—TAM credibility lives or dies on assumption transparency
  • Present as a range rather than a single number to reflect genuine uncertainty

No single method is sufficient. Top-down gives you a macro anchor but can be misleadingly large. Bottom-up forces customer-level thinking but requires accurate unit assumptions. Value-theory connects sizing to actual willingness to pay. Use all three and let the convergence (or divergence) tell you where your understanding is strong or weak.

Top-down starts with a broad industry figure—typically from analyst reports—and progressively narrows it by applying filters relevant to your product. For example: 'The global project management software market is $7B → enterprise segment is $4.2B → companies with 500+ employees represent $2.8B → English-speaking markets are $1.9B.' Each filter should be justified and sourced. The risk is that industry categories rarely match your product perfectly, and overly broad starting points produce misleadingly large TAMs.

  • Start with published industry data from credible analyst firms or government sources
  • Apply progressive filters: geography, segment, company size, use case, pricing tier
  • Each filter must be justified with data or a clear, defensible rationale
  • Risk: industry categories are often broader than your actual addressable market
  • Risk: analyst reports may use different definitions of the market than you intend
  • Best for: establishing a macro ceiling and demonstrating awareness of the broader landscape

Top-down is the easiest method to execute and the easiest to get wrong. The most common mistake is starting with an industry category that's too broad and applying too few filters—producing a TAM that includes millions of customers who would never buy your product. Every filter you apply should make your sizing more credible, not less exciting.

Bottom-up starts from your unit economics and scales outward: how many potential customers exist, what will each pay, and how often will they purchase? You build TAM from the ground level—counting actual customer segments, applying realistic pricing, and multiplying. This method forces customer-level clarity and is generally more credible than top-down because every number maps to a real-world entity you can name and count.

  • Identify and count your potential customer segments as specifically as possible
  • Determine average revenue per customer based on your pricing model
  • Factor in purchase frequency, contract length, and expansion revenue
  • Build from verifiable data: number of companies in an industry, registered professionals, etc.
  • Cross-reference counts with multiple data sources to validate accuracy
  • More labor-intensive than top-down but produces more defensible estimates

Bottom-up is the method that investors trust most because it demonstrates customer-level understanding. When you say 'there are 47,000 SaaS companies with 50–500 employees in North America, and our average contract value is $12,000/year,' you're making claims that can be verified. That verifiability is what makes bottom-up sizing credible.

Value-theory sizing estimates your market based on the total value your product creates and the fraction you can capture as revenue. If your product saves each customer $100,000/year and you charge $10,000/year (10% value capture), your TAM equals the number of potential customers multiplied by $10,000. This approach is especially useful for new categories where there's no existing market to measure—you're sizing the value gap your product fills rather than an existing spending pool.

  • Calculate the total value your product creates: time saved, cost reduced, revenue enabled
  • Determine your value capture ratio: what percentage of that value becomes your price
  • Typical SaaS value capture ratios range from 5%–20% of the value delivered
  • Requires honest, evidence-based estimation of the value customers actually experience
  • Especially powerful for new categories, platform businesses, and efficiency tools
  • Connects market sizing directly to your pricing strategy and value proposition

Value-theory is the most intellectually honest sizing method for products that create new value rather than redirecting existing spend. It also doubles as a pricing validation exercise. If your value capture ratio exceeds 20–30%, you may be overpricing relative to the value delivered. If it's below 5%, you may be underpricing and leaving significant revenue on the table.

The most prevalent mistake is using an industry category that's far broader than your actual product scope—the 'trillion-dollar market' fallacy. Other common errors include conflating TAM with total industry revenue regardless of relevance, ignoring that your product only addresses a subset of the market's needs, double-counting customer segments, and presenting TAM without transparent assumptions that allow others to challenge your methodology.

  • The 'trillion-dollar market' trap: starting with an absurdly broad industry figure
  • Category mismatch: using an industry report that doesn't actually describe your market
  • Ignoring non-consumption: assuming everyone in the category is a potential customer
  • Hidden assumptions: using numbers without explaining the methodology behind them
  • Static thinking: calculating TAM as a snapshot without accounting for market dynamics
  • Confusing revenue with opportunity: TAM should represent your potential revenue, not total industry spend across unrelated categories

Here's a simple credibility test: if your TAM slide makes the audience's eyebrows go up rather than their heads nod, your number is probably too large. A credible TAM is one where every assumption is transparent and every filter is justified. Would you bet your own money on it?

SAM, SOM & Realistic Capture

Narrowing from theoretical opportunity to realistic, near-term revenue targets.

SAM is your TAM filtered by the constraints of your actual business model. Apply every real-world limitation: geography you can serve, languages you support, customer segments you can reach through your distribution channels, pricing tiers that match your positioning, and any technical or regulatory constraints. SAM answers the question: 'Of the total market, which part could we theoretically win if we executed perfectly?'

  • Start with your TAM and apply business model filters systematically
  • Geographic filter: which regions can you realistically serve today?
  • Segment filter: which customer types match your product's current capabilities?
  • Channel filter: which customers can you reach through your distribution model?
  • Pricing filter: which customers fall within your pricing range?
  • Technical and regulatory filters: compliance requirements, integration prerequisites, platform constraints

SAM should feel like an honest answer to 'who could we sell to if we were the only option and executed flawlessly?' It's not about optimism—it's about fit. A well-defined SAM demonstrates strategic focus: you know exactly who you're building for and why those customers, not others.

SOM is the portion of SAM you can realistically capture in a specific timeframe—typically 1–3 years. It factors in competition, your current brand awareness, sales capacity, marketing budget, product maturity, and any switching costs customers face. SOM is essentially your revenue forecast grounded in market reality. For new entrants in competitive markets, SOM typically ranges from 1%–5% of SAM in year one.

  • Start with SAM and apply competitive and execution filters
  • Competition: how much of the SAM is locked up by incumbents with high switching costs?
  • Sales capacity: how many customers can your team realistically reach and close?
  • Marketing reach: what percentage of your SAM is aware you exist?
  • Product maturity: can your product handle the full range of SAM use cases today?
  • Time-bound: SOM should specify 'in the next 12/24/36 months'

SOM is where ambition meets honesty. It's the number you'll actually be measured against. The best SOM estimates work backward from real constraints: 'We have 3 salespeople who can each close 4 deals/month at $15K average, giving us roughly $2.2M in year one.' That's a bottom-up SOM that people can believe.

SOM is a market-derived estimate—it starts from the market and narrows to what you can capture. A revenue forecast starts from your sales pipeline, growth rate, and operational capacity. They should converge: if your revenue forecast exceeds your SOM, either your forecast is too aggressive or your SOM is too conservative. When they diverge significantly, it signals that your market understanding and your operational planning aren't aligned.

  • SOM: top-down from market → what the market allows you to capture
  • Revenue forecast: bottom-up from operations → what your team can produce
  • Both should arrive at a similar range—significant divergence signals a problem
  • SOM helps validate whether your revenue forecast is achievable given market dynamics
  • Revenue forecast validates whether your SOM is operationally grounded
  • Together they form a more complete picture than either alone

Think of SOM as the demand-side ceiling and your revenue forecast as the supply-side projection. Both are essential. A SOM without an operational plan behind it is theoretical. A revenue forecast without a market context is a guess. The combination is a strategy.

Start with analogous products in similar markets—what market share did Slack achieve in its first two years? What about Notion, or Figma? Look at competitors who entered established markets with differentiated products and track their share trajectory. Then adjust for your specific advantages and constraints: distribution strength, switching costs in your market, pricing power, and the urgency of the problem you solve. Avoid the temptation to claim you'll capture 10% of a huge market—work from evidence.

  • Study market share trajectories of analogous products in similar markets
  • First-year share for new entrants in competitive SaaS markets is typically 0.5%–3%
  • Factor in switching costs: high switching costs mean slower but stickier adoption
  • Consider distribution advantages: viral products capture share faster than sales-driven ones
  • Account for market growth: entering a growing market is easier than taking share from a static one
  • Build scenarios: conservative, base, and optimistic with different share assumptions

The question 'what market share can we get?' is really 'how fast and effectively can we convince customers to choose us over alternatives?' Ground your share estimate in the mechanics of how customers discover, evaluate, and switch to new solutions in your specific market. Abstract percentages applied to large markets produce fiction.

Niche Markets & Segmentation

Finding and sizing specific market niches, beachhead strategy, and effective segmentation.

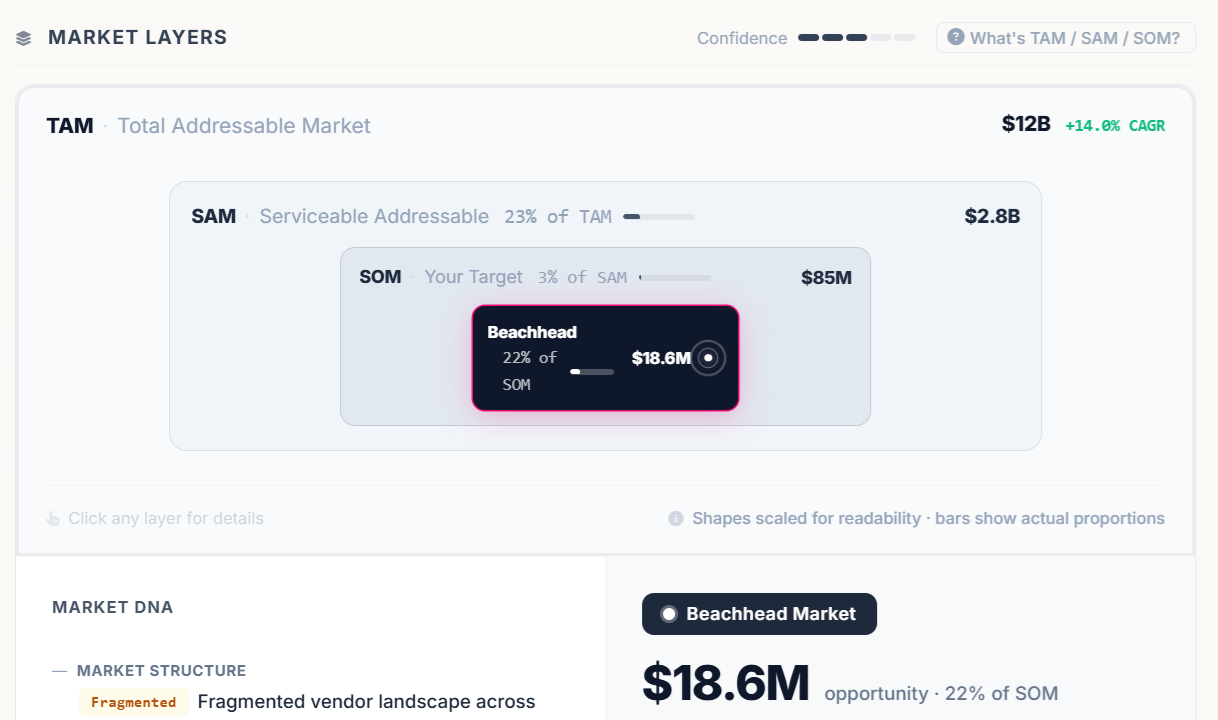
A beachhead market is the specific, narrow segment you target first—your initial foothold from which you can expand. Named after the military concept of securing a small, defensible position before advancing, it's the segment where your product's value proposition is strongest, your competitive advantages are greatest, and your ability to win is highest. Getting this right is arguably more important than your total market size because it determines whether you survive long enough to reach the larger opportunity.

  • A specific, narrow segment where your product-market fit is strongest
  • Should be small enough to dominate but large enough to sustain the business
  • Customers in this segment should have acute pain that your product uniquely addresses
  • Word-of-mouth within the segment should be strong—these customers talk to each other
  • Winning the beachhead creates proof points, case studies, and revenue to fund expansion
  • Common mistake: choosing a beachhead that's too broad, negating the focus advantage

Most successful products didn't start by serving everyone. Facebook started with Harvard students. Amazon started with books. Stripe started with developer-founders. Your beachhead is the segment where you can be the undeniable best option—and that concentration of excellence is what creates the momentum to expand. The key is identifying the segment with the most urgent need and the fewest viable alternatives.

A profitable niche sits at the intersection of three things: a specific, underserved customer segment with an acute problem; willingness and ability to pay for a solution; and a path to reach those customers efficiently. Start by looking for groups of people who share the same frustration with existing solutions and who have budget authority. The best niches are ones where the incumbent solutions are either nonexistent, overbuilt (too complex and expensive), or underbuilt (insufficient for serious users).

  • Look for underserved segments: customers poorly served by generalist solutions
  • Validate the pain: the problem should be frequent, urgent, and consequential
  • Check willingness to pay: can these customers buy, and is the problem worth paying to solve?
  • Assess reachability: can you find and reach these customers cost-effectively?
  • Evaluate defensibility: can you build expertise and relationships that generalists can't replicate?
  • Test concentration: do these customers share communities, conferences, publications, or workflows?

The ideal niche is one where customers are actively looking for a solution, can afford one, and gather in places where you can reach them efficiently. If you find yourself trying to convince customers they have a problem, you haven't found a niche—you've found a hypothesis that needs more product discovery.

The most useful segmentations for product strategy go beyond demographics into behavioral and needs-based dimensions. Segment by the job customers are trying to accomplish, the urgency and frequency of their need, their current solution and satisfaction level, their buying behavior and decision-making process, and their willingness to adopt new solutions. The goal is to find segments where your product's specific strengths create the most differentiated value.

  • Jobs-to-be-done: segment by the outcome customers are trying to achieve, not who they are
  • Behavioral: how do they currently solve the problem? What tools do they use?
  • Needs-based: what specific requirements differentiate one group from another?
  • Firmographic: company size, industry, growth stage, technology maturity (for B2B)
  • Psychographic: attitudes toward innovation, risk tolerance, buying autonomy
  • Economic: budget availability, price sensitivity, purchasing process complexity

The segmentation that matters most is the one that predicts buying behavior. If two companies look identical on firmographics but one has an urgent need and the other doesn't, the behavioral segmentation is more useful than the demographic one. Segment for action, not description. For deeper persona work, see how Ainna's Persona Analysis applies structured methodology to behavioral segmentation.

Niche market sizing demands precision where mainstream sizing can tolerate approximation. In a niche, you should be able to identify customers nearly individually—or at least describe them precisely enough that a salesperson could build a target list. Your TAM may look small, but your SOM/SAM ratio will be much higher because you're the best (or only) solution for that specific need. The expansion story becomes critical: how does this niche connect to adjacent segments over time?

  • Niche: smaller TAM but higher capture rates; you can often name your potential customers
  • Mainstream: larger TAM but lower capture rates; requires broader go-to-market capability
  • Niche sizing relies more on bottom-up counting than top-down industry data
  • For niches, the expansion narrative matters as much as the initial sizing
  • Niche premium pricing often compensates for smaller customer counts
  • Investors evaluate niche plays on dominance potential and expansion path, not just TAM

A $50M niche where you can capture 30% is a better business than a $5B market where you'll capture 0.1%. Niche sizing should emphasize capture mechanics and expansion logic, not apologize for a smaller top-line number. Show the path: dominate segment A, expand to adjacent segment B, then C. That's a growth story investors and stakeholders can follow.

Adjacent markets share at least one critical dimension with your current market—similar customers with different needs, different customers with similar needs, or the same underlying technology applied to a new context. Map adjacencies by identifying what your beachhead customers share with nearby segments: overlapping workflows, shared buying centers, common technology stacks, or similar regulatory environments. The most natural expansion paths follow the strongest overlaps.

  • Same customer, new need: expand the product for existing customers (e.g., analytics tool adds reporting)
  • Same need, new customer: apply your solution to a different segment (e.g., SMB to enterprise)
  • Geographic expansion: same product and segment in new regions or markets
  • Value chain expansion: move upstream or downstream in the customer's workflow
  • Technology adjacency: apply your core capability to a related domain
  • Prioritize adjacencies where existing customer proof points accelerate credibility

Your expansion map is a strategic asset—it shows stakeholders and investors that today's market is a starting point, not a ceiling. The best adjacent moves leverage existing strengths (technology, brand, relationships) rather than requiring you to build entirely new capabilities for each expansion. Each move should be a logical step, not a leap of faith.

Methodologies & Data Sources

Practical approaches, data sources, and analytical techniques for credible market sizing.

The best market sizing combines multiple data source types: industry analyst reports for macro context, government databases for demographic and economic data, public company filings for competitive revenue benchmarks, industry associations for segment-specific statistics, and your own primary research for customer-level validation. No single source is sufficient—triangulation across source types is what produces credible estimates.

  • Analyst firms: Gartner, IDC, Forrester, Statista for industry-level market data
  • Government sources: Census data, Bureau of Labor Statistics, Eurostat, UN databases for demographic and economic baselines
  • Public filings: SEC filings, annual reports for competitor revenue and market share data
  • Industry associations: trade groups often publish detailed segment-level statistics
  • Primary research: surveys, interviews, and willingness-to-pay studies for customer-level validation
  • Aggregators: Crunchbase, PitchBook, CB Insights for startup ecosystem and funding data

Free sources (government data, public filings, industry associations) get you surprisingly far. Paid analyst reports add depth and save time but should never be taken at face value—always understand their methodology and definitions. The most underutilized source is your own customer conversations: talking to 15–20 potential customers about their current spending and priorities produces better sizing inputs than any report.

Triangulation means using multiple independent methods to estimate the same market and comparing the results. If top-down, bottom-up, and value-theory approaches produce numbers in the same range, your estimate is robust. If they diverge wildly, at least one set of assumptions is flawed—and investigating the divergence often produces the most valuable strategic insight of the entire exercise.

  • Use at least two independent methods (ideally three) for every market sizing exercise
  • Compare results: convergence builds confidence; divergence reveals flawed assumptions
  • Investigate discrepancies—they often surface the most important strategic questions
  • Present all methods to stakeholders with explanations of why they converge or diverge
  • Triangulation also applies to data sources: cross-reference multiple sources for key inputs
  • The goal is a defensible range, not false precision from a single methodology

When your top-down says $2B and your bottom-up says $400M, you don't have a market sizing problem—you have a strategic clarity problem. One of your methods is using the wrong market definition, the wrong customer count, or the wrong price assumption. Finding and resolving that discrepancy is where the real strategic value lives.

Growth rates come from three sources: historical data (what has the market done over the past 3–5 years?), analyst forecasts (what do credible research firms project?), and driver-based modeling (what underlying forces—technology adoption, regulatory change, demographic shifts—will accelerate or decelerate growth?). The most sophisticated approach combines all three, with driver-based analysis explaining why the future might differ from the past.

  • Historical CAGR: calculate compound annual growth from published market data over 3–5 years
  • Analyst projections: credible firms publish 5-year forecasts with methodology
  • Driver-based modeling: identify specific forces that will accelerate or decelerate growth
  • Technology adoption curves: where is the market on the S-curve? Early, mainstream, or saturated?
  • Regulatory catalysts: upcoming regulations can create or destroy market segments rapidly
  • Present scenarios: base, bull, and bear cases with different growth assumptions

Markets growing at 20%+ per year are fundamentally different from markets growing at 3%. In fast-growing markets, you can capture share simply by acquiring new customers faster than competition. In slow-growing markets, every customer you win is one a competitor loses—a much harder and more expensive dynamic. Your growth rate assumption changes your entire strategy, so get it right.

Pricing is a multiplier in every market sizing formula—get it wrong and your entire analysis is off by that factor. Your TAM changes dramatically depending on whether you price at $10/month or $1,000/month: the number of willing buyers shifts, the market segment changes, and the competitive landscape reshuffles. Price too high and your addressable market shrinks; price too low and the opportunity isn't worth pursuing. Market sizing and pricing strategy are inseparable.

  • Price is a direct multiplier: Total Market = Customers × Price × Frequency
  • Different price points attract different customer segments with different sizes
  • Premium pricing shrinks customer count but increases revenue per customer and market positioning
  • Low pricing expands the addressable base but may make unit economics unworkable
  • Consider the pricing of alternatives: your price relative to substitutes affects adoption rate
  • Sensitivity analysis: model your TAM at multiple price points to understand the trade-offs

Always model your market at multiple price points. A product priced at $50/month has a different TAM than the same product at $500/month—not just because of the math, but because different customers are addressable at each price. The market sizing exercise should inform your pricing strategy and vice versa.

Markets are living systems that grow, shrink, fragment, converge, and get disrupted. Your market sizing should model these dynamics explicitly: what trends are expanding or contracting the market? What new entrants or technologies could reshape it? What regulatory changes are on the horizon? A static TAM snapshot is useful for a pitch slide but useless for strategic planning. Build a dynamic model that updates as assumptions change.

  • Model growth and contraction: markets expand with adoption and contract with saturation
  • Track convergence and fragmentation: markets merge (e.g., smartphones absorbed cameras, GPS, music players) or split
  • Monitor disruption vectors: new technologies, business models, or regulations that reshape the landscape
  • Build updatable models: spreadsheets with adjustable assumptions, not static slides
  • Review quarterly: market sizing should be a living document, not a one-time exercise
  • Scenario planning: model best-case, base-case, and worst-case market trajectories

The market you size today may not exist in the same form in three years. The best market analyses build in flexibility—they're models you can update as you learn, not monuments to your original assumptions. Make your assumptions visible, make them adjustable, and revisit them regularly.

Communicating Market Sizing

Presenting market analysis to investors, stakeholders, and teams with clarity and credibility.

Investors see thousands of market sizing slides—most are either absurdly large ('we're in a trillion-dollar market') or suspiciously precise ('our SOM is exactly $47.3M'). What makes a market sizing presentation credible is methodology transparency, honest assumptions, and a clear narrative connecting TAM to your specific SOM to your actual revenue plan. Show the funnel, explain each filter, and demonstrate that you understand not just the size of the market but how you'll capture your piece of it.

  • Lead with the methodology, not just the number—'here's how we calculated this'
  • Show the funnel clearly: TAM → SAM → SOM with each filter labeled and explained
  • Use bottom-up as your primary evidence, top-down as validation and context
  • Make key assumptions explicit and challengeable—investors will probe them
  • Connect SOM to your operational plan: sales capacity, marketing reach, product maturity
  • Present the expansion narrative: how does today's SOM grow toward the larger SAM over time?

The best market sizing presentations don't just answer 'how big is the market?' They answer 'here's why we believe this opportunity is real, here's how we'll capture our initial share, and here's the path to a much larger business.' That narrative—grounded in transparent methodology—is what converts skeptical investors into believers. Tools like Ainna can help generate investor-ready market analysis with this level of rigor and transparency.

A market sizing narrative is not just numbers—it's a strategic argument. Start with the customer problem (why does this market exist?), then establish the scale of that problem (how many people face it and what do they spend today?), then narrow to your specific opportunity (which segment can you serve best?), and finally connect to your plan (here's how we capture that opportunity). Every number should serve the narrative, not replace it.

  • Open with the problem and why it creates a market—make the audience feel the need
  • Establish scale: quantify the pain in terms of money, time, or missed opportunities
  • Show your unique angle: why does this market need your specific solution?
  • Narrow credibly: each filter in your TAM → SAM → SOM funnel should feel logical and earned
  • Connect to execution: the story ends with 'and here's how we capture this' not just 'and it's big'
  • Use customer evidence: quotes, survey data, or behavioral signals that validate the opportunity

Numbers without narrative are forgettable. Narrative without numbers is unconvincing. The best market sizing stories weave both together: 'Product managers at mid-market SaaS companies spend an average of 15 hours per month on documentation that should take 2 hours. There are 47,000 such companies in North America. At $79/month, that's a $44.5M SAM—and we can reach 3,000 of them in year one through content marketing and partnerships.'

Different stakeholders care about different aspects of market sizing. Investors focus on the total opportunity and the path to capturing it. Executive leadership wants alignment with corporate strategy and resource justification. Engineering teams need to understand the scale requirements. Sales teams want to know who and how many prospects to target. Tailor the same underlying analysis with different emphasis for each audience.

  • Investors: emphasize TAM ceiling, SAM focus, growth rate, and the competitive gap you exploit
  • Board/leadership: connect to corporate strategy, show resource ROI and strategic alignment
  • Product teams: focus on segment-level sizing that informs roadmap and feature prioritization
  • Sales teams: translate SOM into target account lists, territories, and quota rationale
  • Engineering: convey scale implications—user volume, transaction rates, infrastructure needs
  • Partners: emphasize the shared opportunity and how partnership expands the addressable market

The underlying analysis is the same—but the story you tell with it changes. An investor wants to hear about the $2B opportunity. Your VP of Sales wants to know that there are 850 target accounts in their territory. Both numbers come from the same analysis—but they serve different decisions. This is exactly where stakeholder-specific outputs from Ainna add value—different stories from the same strategic foundation.

Every market sizing number is only as credible as the assumptions behind it. Transparent assumptions invite productive debate, demonstrate intellectual honesty, and allow stakeholders to engage with your logic rather than just your conclusion. Hidden assumptions create the illusion of precision while concealing uncertainty. The moment someone challenges a number you can't explain, your entire analysis loses credibility.

  • Every input should have a stated source or rationale: 'X per source Y' or 'estimated based on Z'
  • Confidence levels help: distinguish between verified data points and educated estimates
  • Invite challenges: 'we assumed X—if the actual number is Y, here's how the sizing changes'
  • Sensitivity analysis: show which assumptions have the biggest impact on the final number
  • Version your assumptions: as you learn more, update and document what changed
  • Distinguish between facts, projections, and judgment calls explicitly

The goal is not to defend your number—it's to defend your methodology. A market sizing where someone can challenge any assumption and you can explain your reasoning, acknowledge uncertainty, and show the sensitivity is infinitely more credible than a polished number with no visible foundation. Intellectual honesty is a competitive advantage in market analysis.

Common Pitfalls & Best Practices

The mistakes that undermine market sizing credibility and how to avoid them.

The most damaging mistakes fall into three categories: aspirational thinking disguised as analysis (choosing numbers that support the conclusion you want), methodological shortcuts (using only one approach without triangulation), and static thinking (sizing the market once and never revisiting assumptions). The specific errors—overly broad TAMs, hidden assumptions, conflated categories—all flow from these root causes.

  • Confirmation bias: starting with the desired conclusion and working backward to justify it
  • The 'everyone is our customer' fallacy: assuming universal relevance without segmentation evidence
  • Single-method reliance: using only top-down or only bottom-up without cross-validation
  • Category inflation: using a broader market definition than your product actually addresses
  • Ignoring substitutes: not accounting for customers who solve the problem differently or cheaply
  • Stale analysis: sizing the market once for a pitch and never updating as you learn

The antidote to all of these is intellectual honesty. Ask yourself: 'If I were investing my own money based solely on this market analysis, would I be confident?' If the answer is no, keep refining until it's yes.

Experienced investors and stakeholders spot weak market sizing immediately. The telltale signs: a single, suspiciously round TAM number with no methodology shown; a TAM that's clearly just an industry report number with no filtering; a SOM that implies unrealistically high market share; no acknowledgment of competition or substitutes; and assumptions that are either missing entirely or buried in appendices rather than presented alongside the numbers.

  • Round numbers with no decimal places or ranges: '$5B market' without any methodology
  • No visible funnel: TAM presented without SAM and SOM breakdown
  • SOM implies >5% market share in year one for a competitive market
  • No competition mentioned: as if the market is waiting empty for you to arrive
  • Methodology-free: numbers presented as facts without explaining how they were derived
  • Perfect alignment: every number conveniently supports the fundraising ask

If your market sizing wouldn't survive 10 minutes of questions from a skeptical analyst, it's not ready. The best test is to present it to someone who has incentive to find the holes—a finance colleague, an advisor, or a prospective customer who knows the market. Their objections are the roadmap to a stronger analysis.

Credible market sizing follows six principles: use multiple methods and triangulate, make every assumption transparent, present ranges instead of point estimates, validate with primary research, update as you learn, and tell a coherent strategic story that connects the numbers to your execution plan. The goal is not the biggest defensible number—it's the most honest assessment of the opportunity.

  • Triangulate: always use at least two independent methods and explain discrepancies
  • Show your work: every number needs a visible source or rationale
  • Use ranges: present conservative, base, and optimistic scenarios with explicit drivers
  • Talk to customers: primary research validates (or invalidates) secondary data
  • Update regularly: treat market sizing as a living model, not a static slide
  • Connect to action: every number should inform a decision—sizing, pricing, prioritization, or resourcing

The market analysis that changes a decision is worth a hundred times more than one that decorates a slide deck. Build your sizing to be useful—to yourself and your team—not just presentable. If the process of sizing the market doesn't change how you think about your product, you're probably doing it wrong.

Match the depth to the decision. A hackathon pitch needs directional sizing you can produce in an hour. A Series A deck needs rigorous, multi-method analysis that takes days. A corporate investment committee needs methodology that aligns with internal standards. The key is knowing what level of confidence you need: directional (order of magnitude), defensible (methodology-backed), or precise (primary-research-validated).

  • Directional (1–2 hours): quick top-down with one analyst source, rough bottom-up sanity check
  • Defensible (1–2 days): multi-method triangulation, transparent assumptions, scenario ranges
  • Precise (1–2 weeks): primary research, customer validation, detailed competitive analysis
  • Start directional and progressively refine—don't try to be precise on day one
  • The decision being made should dictate the required confidence level
  • AI-assisted tools can accelerate the defensible tier to hours instead of days

Perfectionism is the enemy of useful market sizing. A directional analysis today that informs a decision is worth more than a precise analysis next month that confirms a decision already made. Start fast, iterate toward rigor, and always match the investment in analysis to the investment riding on the conclusion. Ainna's Market Outlook is designed to produce defensible-tier analysis at directional-tier speed.

Market sizing without competitive context is like estimating a fishing spot without knowing how many other boats are already there. You need to understand who else serves your SAM, how much of it they've captured, what switching costs protect their position, and where the gaps exist that you can exploit. Competitive analysis transforms your SOM from a percentage guess into a strategic claim about where and how you'll win.

  • Map the competitors: who serves your SAM today and what share do they hold?
  • Identify underserved segments: where are customers poorly served by existing solutions?
  • Assess switching costs: high switching costs shrink your realistic SOM; low costs expand it
  • Evaluate competitor vulnerability: pricing gaps, feature gaps, satisfaction gaps
  • Consider indirect competition: spreadsheets, manual processes, and 'doing nothing' are competitors
  • Factor in market response: how will incumbents react when you enter?

The most honest SOM estimate accounts for competitive reality: 'There are 5 established players serving this SAM, but none of them serve the mid-market segment well, and 40% of potential customers are using spreadsheets instead—that's our entry point.' That level of competitive awareness makes your market sizing credible and your strategy specific. For structured competitive mapping, see how Ainna's Competition Analysis integrates with market sizing.

Market Sizing for Specific Contexts

Adapting market sizing approaches for different product types, stages, and business models.

SaaS market sizing has a natural advantage: the recurring revenue model makes unit economics clear and scalable. Your formula is: number of potential accounts × expected annual contract value (ACV) × retention rate. The nuances lie in segmenting by company size (each tier has different ACV and sales motion), accounting for seat-based versus company-based pricing, factoring in net revenue retention (expansion within existing accounts), and distinguishing between new-logo acquisition and account expansion in your SOM model.

  • Bottom-up formula: target accounts × ACV × retention rate = recurring market opportunity
  • Segment by company size: SMB, mid-market, and enterprise have different ACVs and sales motions
  • Factor seat count or usage: per-seat pricing scales TAM with average team size
  • Include net revenue retention: existing customers often expand usage over time (NRR >100%)
  • Distinguish acquisition vs expansion: new-logo SOM is different from account growth SOM
  • Consider the land-and-expand model: enter with a low-touch product, expand with higher-value tiers

SaaS market sizing is uniquely powerful because every assumption is testable through actual sales data. Once you have even 20–30 customers, you can validate your ACV assumptions, win rates, and expansion patterns against real evidence. Use early data aggressively to refine your model—that's the advantage of recurring revenue.

Platform and marketplace sizing requires thinking about both sides: supply and demand. Your TAM should reflect the total transaction value or activity facilitated, while your revenue comes from a take rate or fee structure applied to that volume. The chicken-and-egg challenge means your SOM depends on liquidity—reaching the critical mass of supply and demand that makes the platform useful. Size both sides independently and model the interaction effects.

  • Size the total transaction value (GMV) facilitated by the marketplace
  • Apply your take rate or fee structure to GMV to calculate your revenue TAM
  • Model both sides: how many suppliers/creators and how many buyers/consumers?
  • Account for the liquidity threshold: minimum supply and demand needed for the platform to work
  • Consider network effects: each participant makes the platform more valuable for others
  • SOM depends on reaching critical mass in a specific geography, category, or vertical first

Platform market sizing is more complex than product market sizing because you're modeling an ecosystem, not a transaction. The TAM is large (total facilitated value) but the path to SOM requires solving the cold-start problem in a specific segment first. Focus your sizing story on the beachhead where you'll achieve liquidity, then show the expansion path.

Speed is the constraint, but credibility still matters. Use a rapid bottom-up approach: identify your target customer in one sentence, estimate how many exist using publicly available data, apply your expected price, and calculate. Cross-check with one top-down source. The key is to show you've thought about who would actually buy this and can ground the number in something verifiable—even if the analysis is rough, it demonstrates strategic thinking that separates your pitch from the rest.

  • Define your customer in one sentence: 'mid-market SaaS companies with 50–200 employees'
  • Find the count: LinkedIn, industry databases, or government data to estimate how many exist
  • Apply your price: what would they realistically pay? Use competitor pricing as a benchmark
  • Calculate: customers × price × frequency = your directional TAM
  • Cross-check with one analyst source or comparable product's reported market size
  • Present the logic, not just the number—judges evaluate your thinking, not your spreadsheet

In a hackathon or pitch competition, a $200M TAM with clear logic beats a $5B TAM with no methodology. Judges and evaluators are looking for evidence that you understand your customer and the opportunity—not that you can cite the biggest possible number. Show the thinking. That's what wins. Ainna's Hackathon Pack is designed to produce exactly this kind of rapid, credible market analysis.

Geographic market sizing requires more than multiplying domestic figures by population ratios. Each market has different purchasing power, competitive landscapes, regulatory environments, cultural adoption patterns, and channel structures. The most common mistake is assuming that a product's success in one market translates directly to similar-sized opportunities elsewhere. Size each target geography individually, accounting for local specifics, then aggregate for your global TAM.

  • Size each target market individually—don't just extrapolate from your home market
  • Adjust for purchasing power: same product, different willingness to pay across geographies
  • Research local competitors: the competitive landscape varies significantly by region
  • Consider regulatory differences: data protection, licensing, certification requirements
  • Factor in go-to-market differences: channel structures, sales culture, marketing norms
  • Prioritize markets by size, accessibility, and fit—not just population or GDP

International expansion is an adjacency play—and like all adjacencies, it should be prioritized based on where your existing strengths create the most leverage. A product that dominates in the US mid-market may find its best second market isn't the largest economy but the one with the most similar customer profile and competitive gap.

B2B and B2C market sizing use the same TAM/SAM/SOM framework but differ in every input. B2B has fewer, larger customers with longer sales cycles and higher ACVs—you can often count your TAM customers individually. B2C has far more customers at lower price points with faster purchase decisions. B2B sizing depends heavily on firmographic data and sales capacity; B2C depends on demographic data and distribution reach.

  • B2B: fewer customers, higher ACV, longer cycles; bottom-up counting is often feasible
  • B2C: millions of potential customers, lower price points; statistical estimation is necessary
  • B2B SAM filters: industry, size, technology stack, budget authority, decision-making process
  • B2C SAM filters: demographics, geography, income, behavior, channel accessibility
  • B2B SOM depends on sales team capacity and account-based go-to-market
  • B2C SOM depends on marketing reach, distribution channels, and viral mechanics

The core question is the same in both—'how many customers will pay how much how often?'—but the path to answering it differs. B2B founders should be able to show a list of their first 50 target accounts. B2C founders should be able to describe their acquisition channels and unit economics. Both demonstrate customer-level understanding—just at different resolutions.